Top 5 Leading Cancers, 2003–2008
TOP 5 CANCERS OVERALL
Prostate cancer
was the top cancer by percentage of total (n=2,688, 20.6%), followed by
breast
(n =2,220, 17.0%),
colon and rectum (n=1,432, 11.0%),
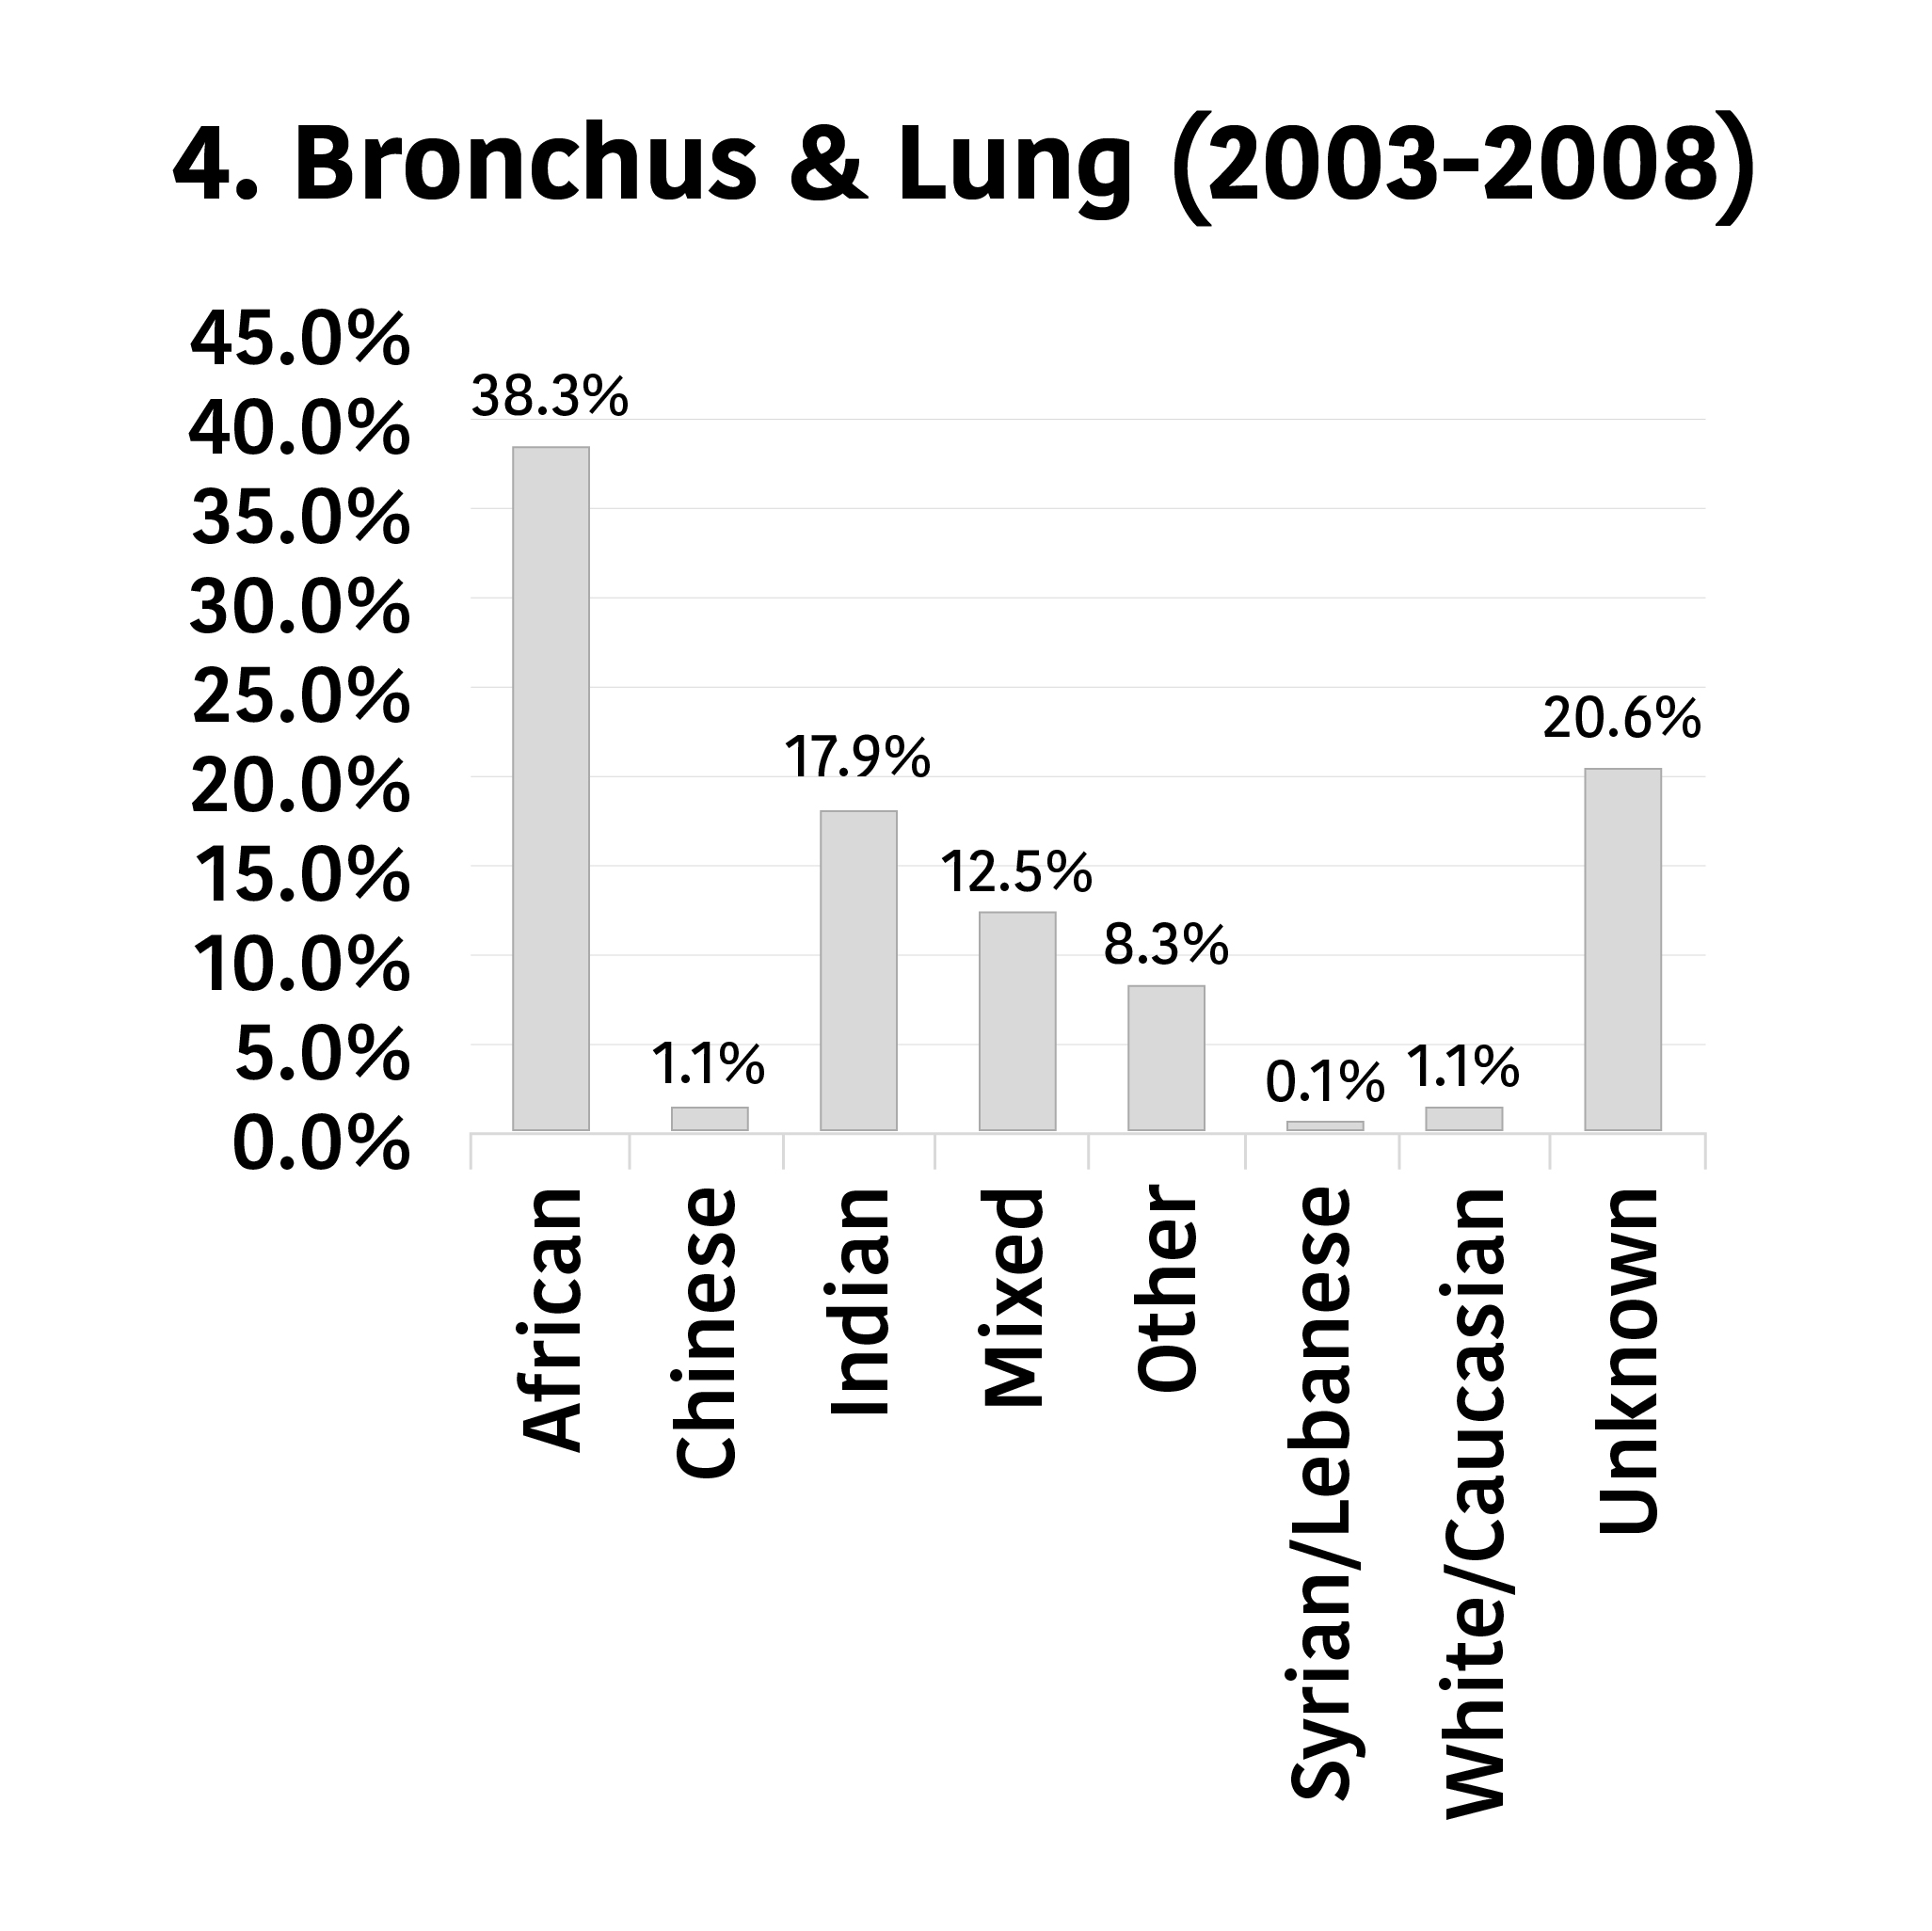
bronchus and lung (n=806, 6.2%),
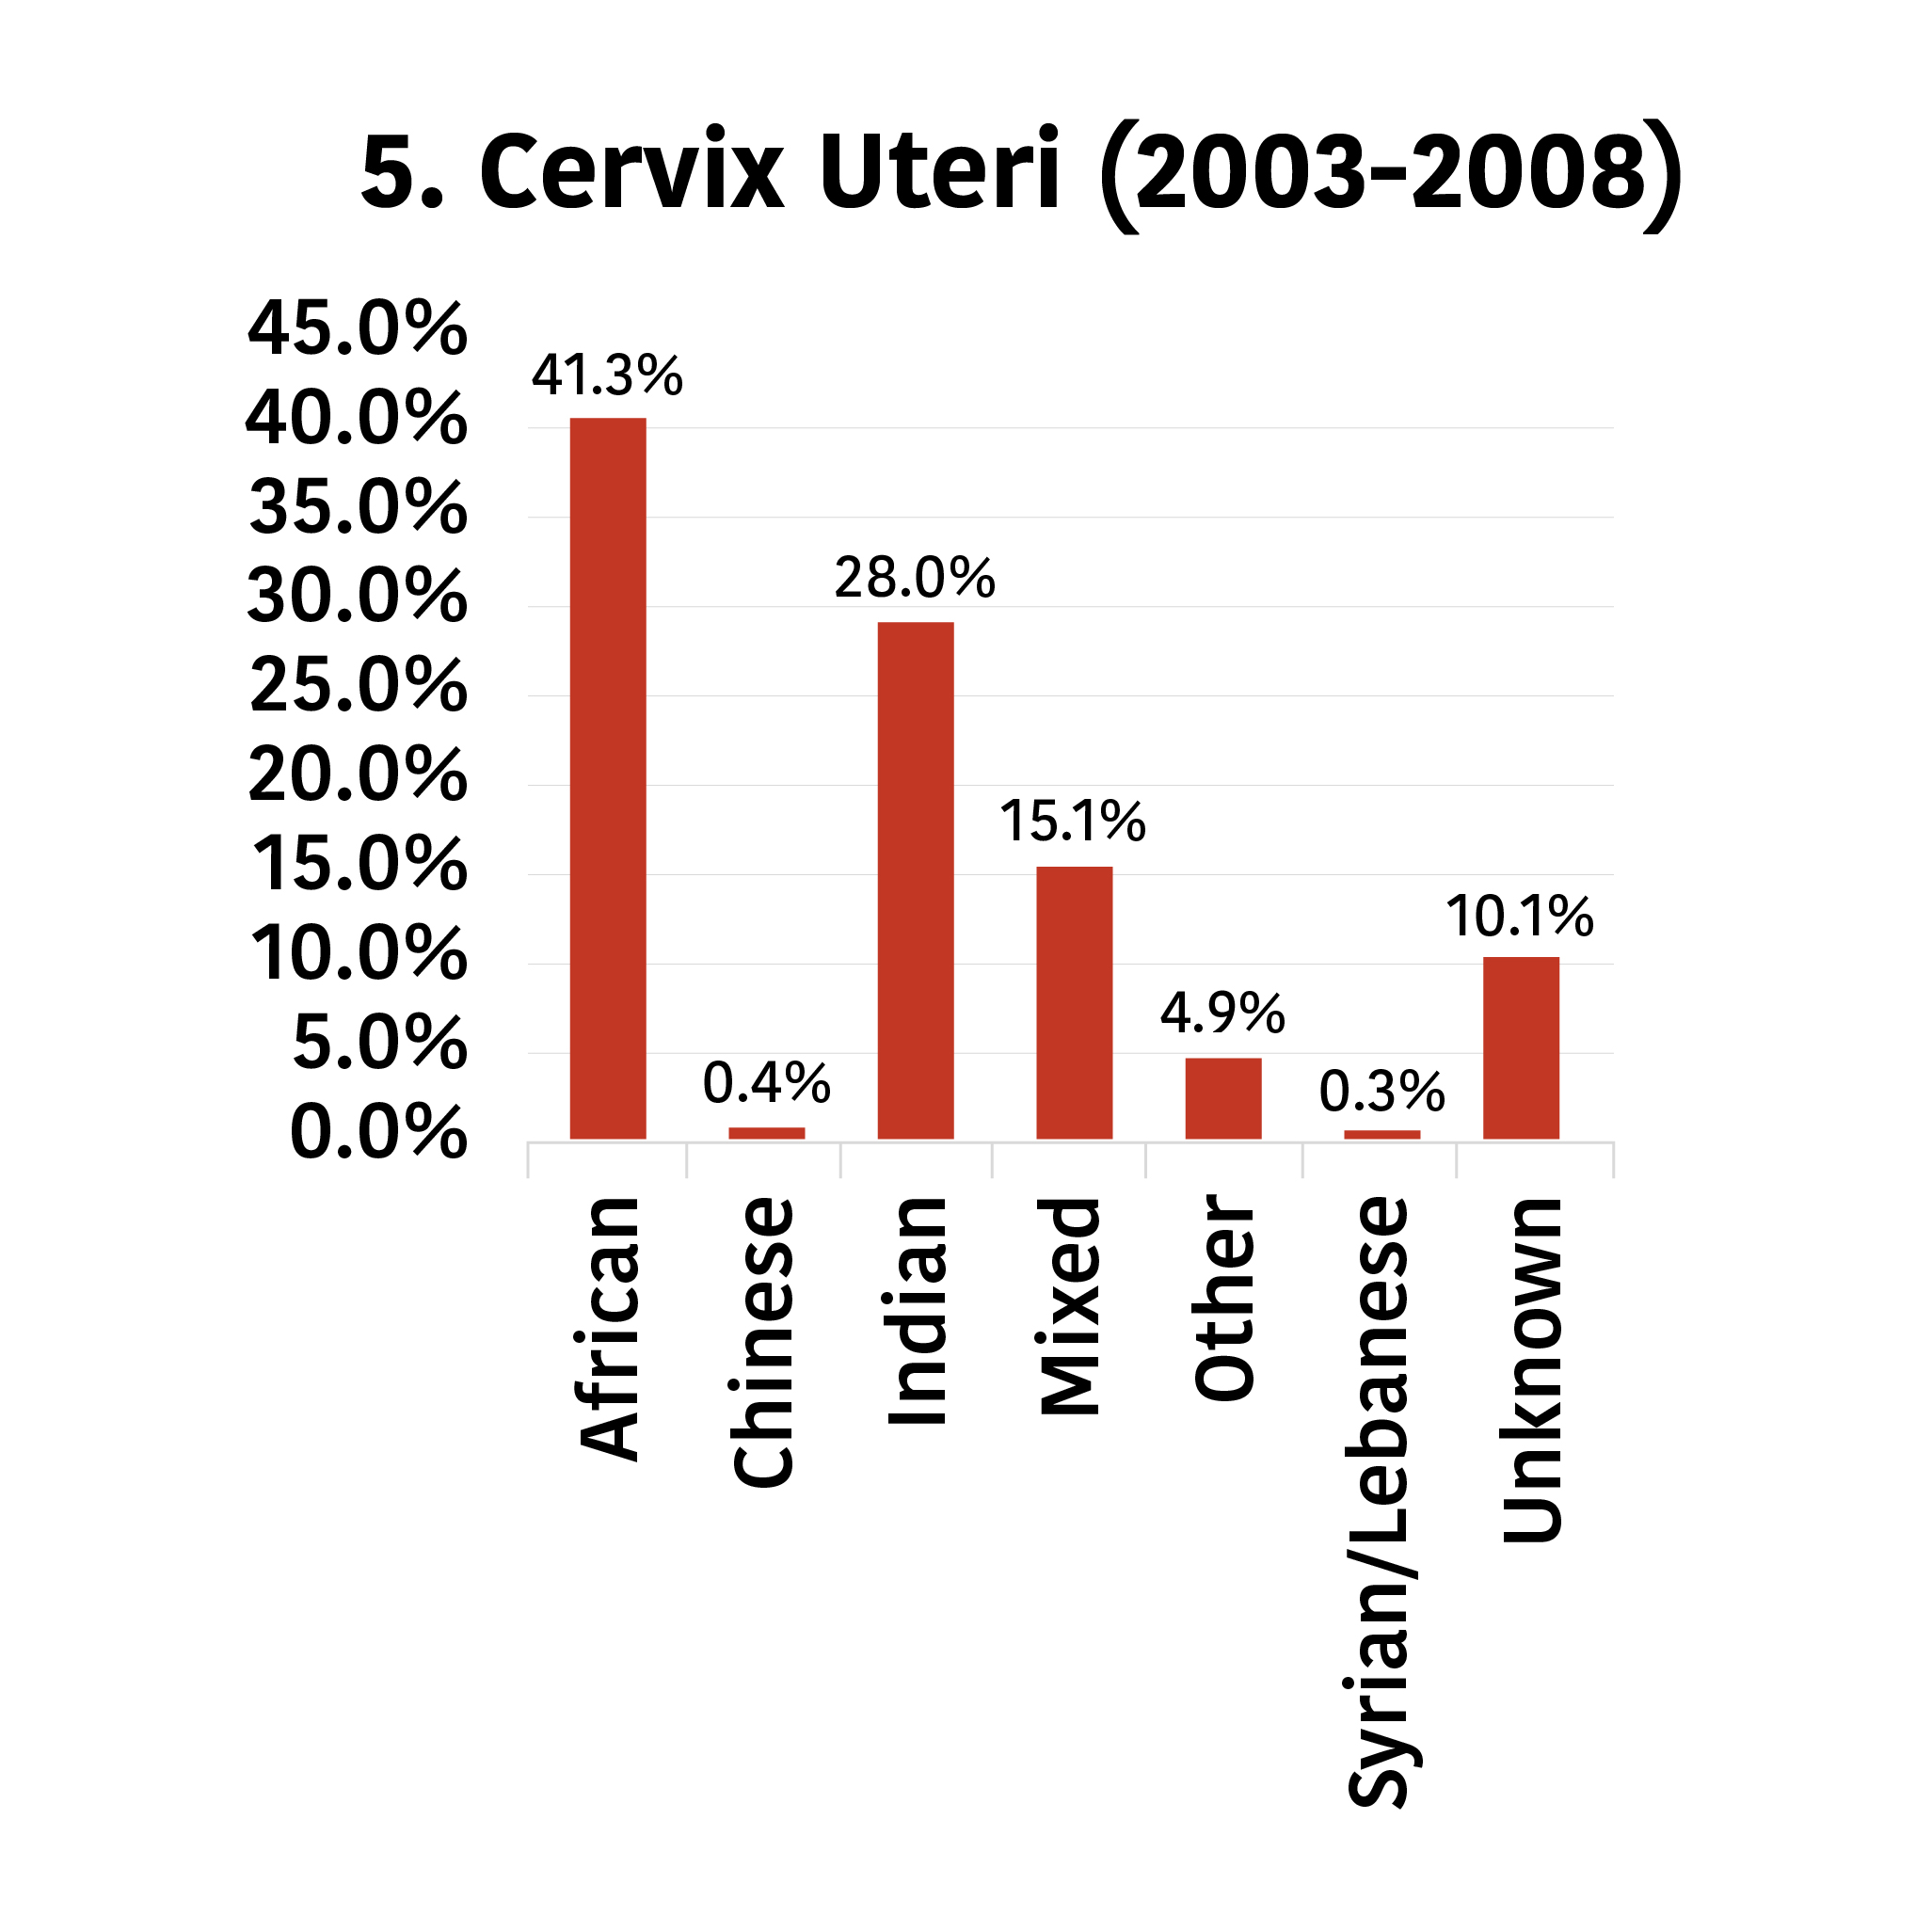
and cervix uteri (n=736, 5.6%).
Figure 5.1:
Top 5 Cancers Overall, 2003 to 2008
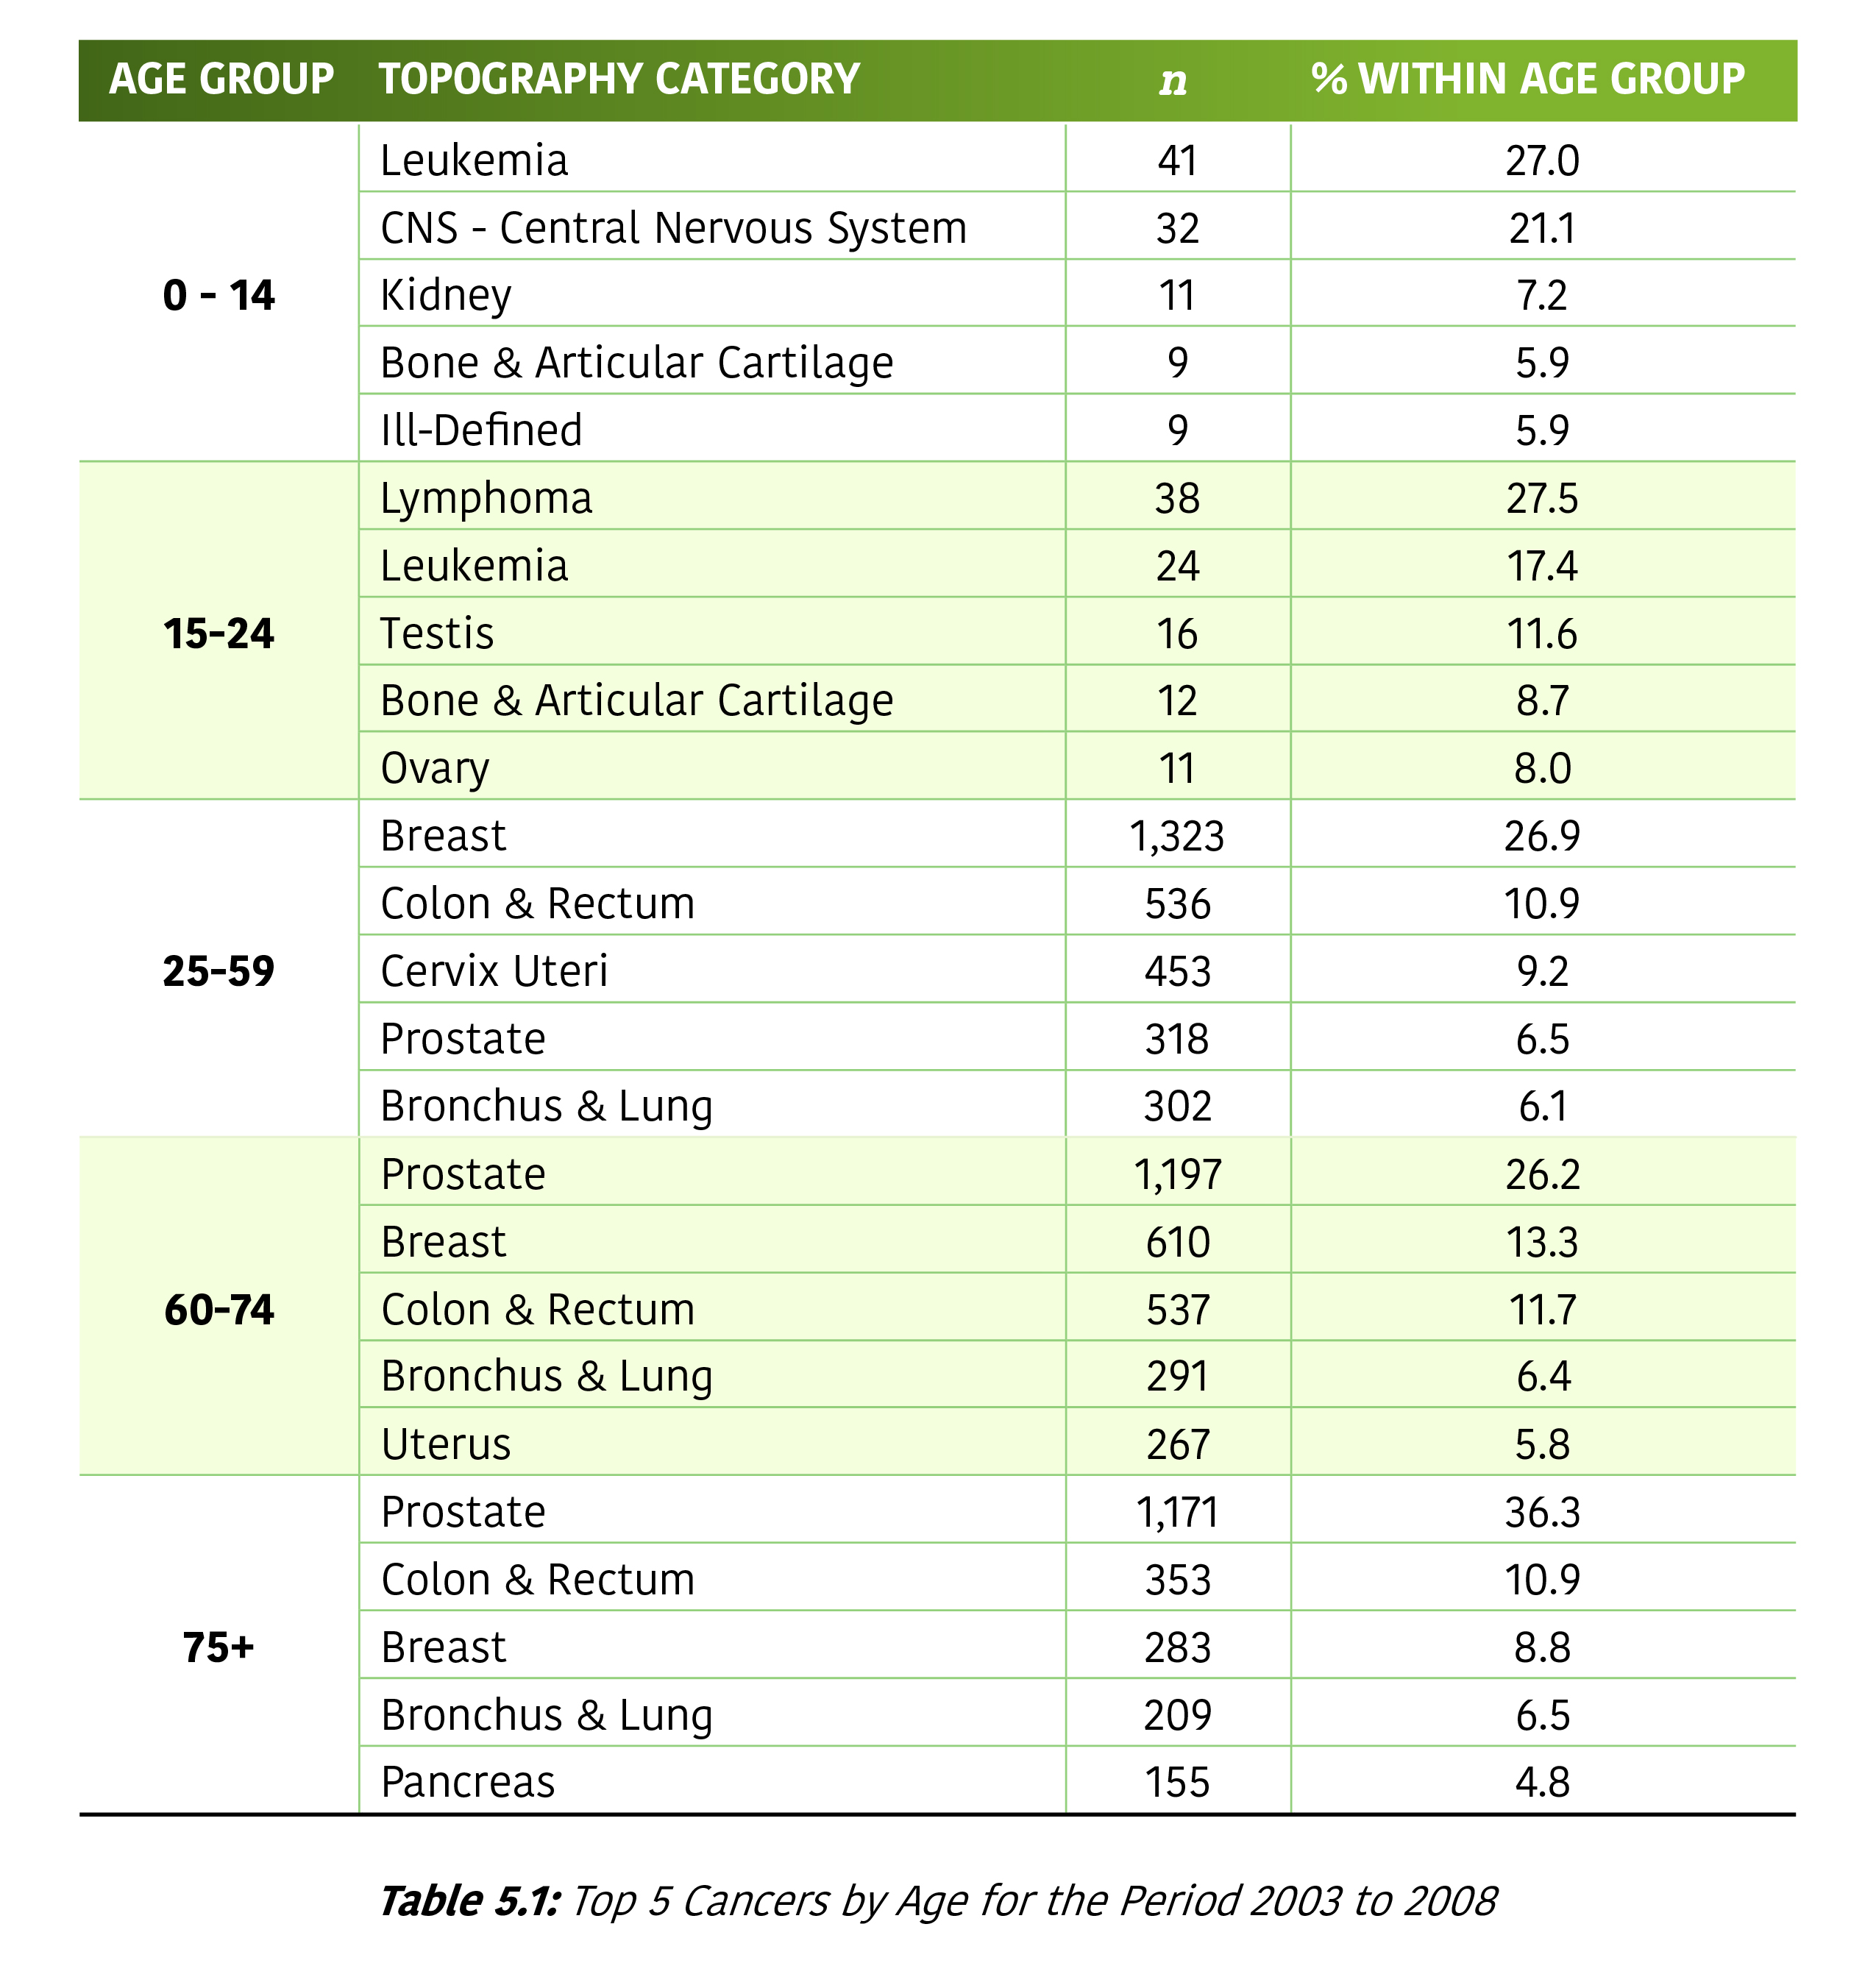
TOP 5 CANCERS BY AGE GROUP
There were:
- 152 persons diagnosed with cancer within the age group 0 to 14 years;
- 138 persons in the age group 15 to 24 years;
- 4,914 persons in the age group 25 to 59 years;
- 4,571 persons in the age group 60 to 74 years; and
- 3,228 persons aged 75 years and over.
-
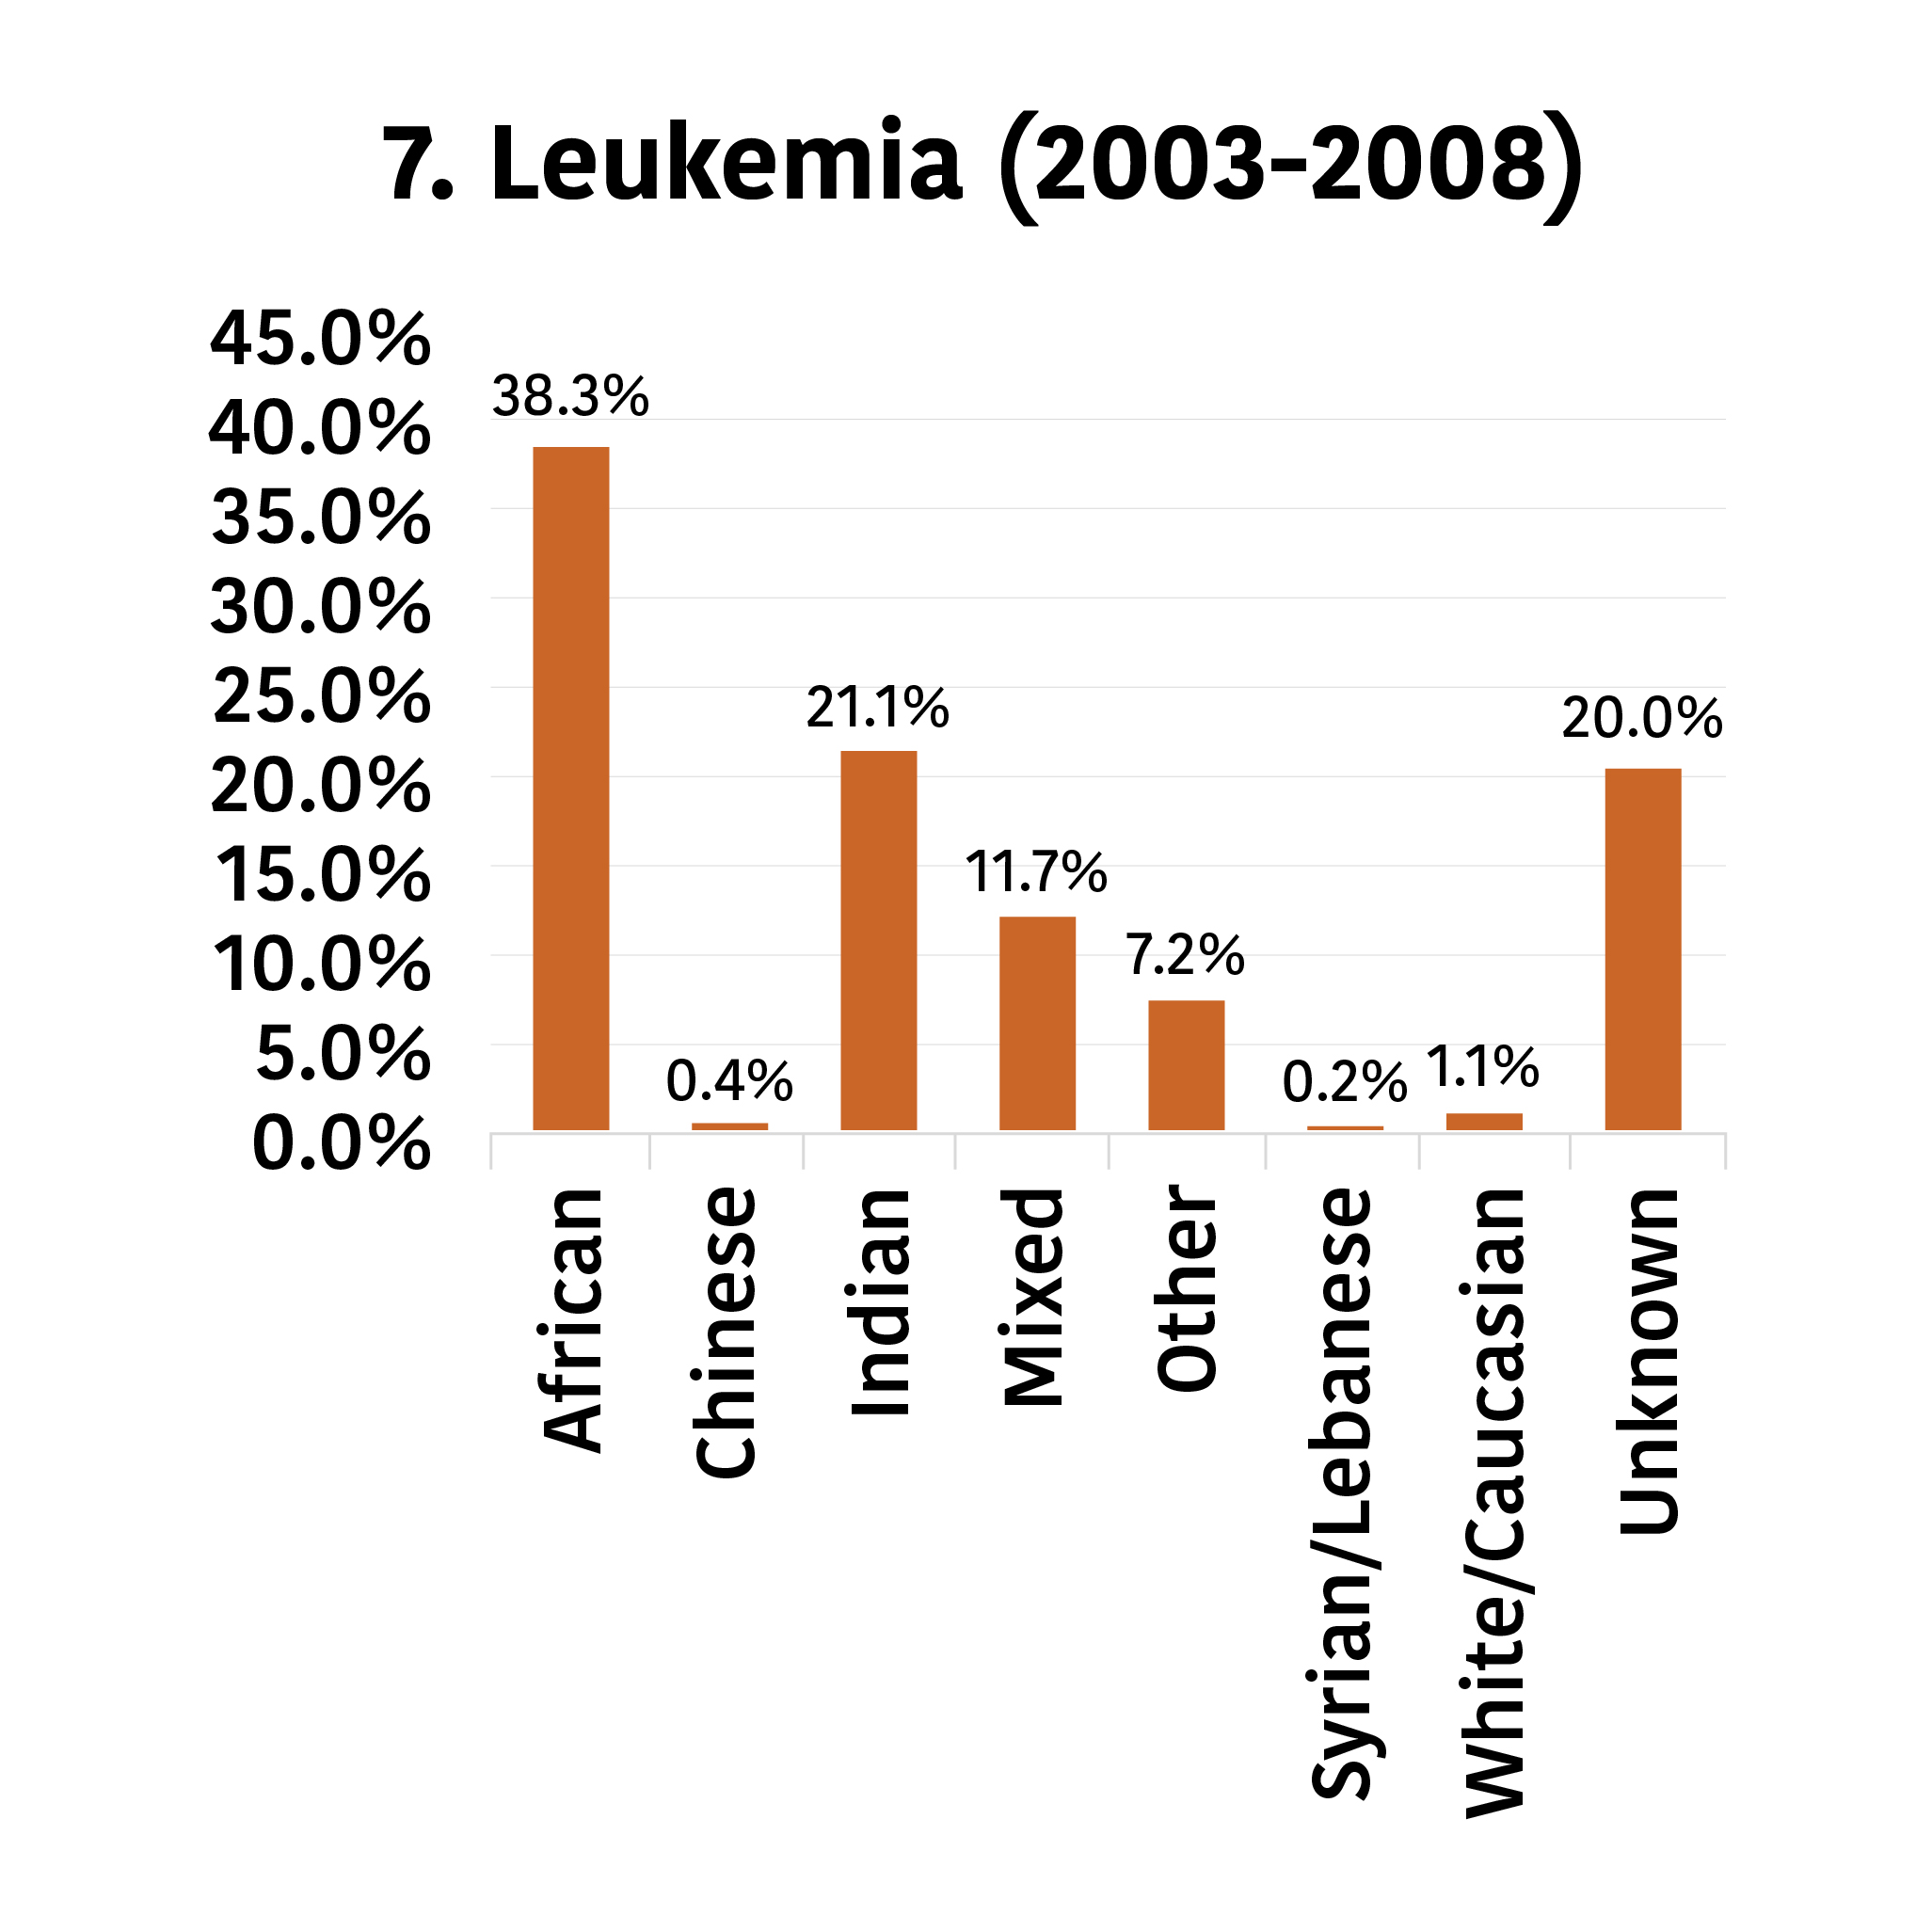
 Leukemia had the highest incidence among individuals under 15 years.
-
 Lymphoma had the highest rate in the 15 to 24 age group.
-
 Breast cancer had the highest incidence among those aged 25 to 59.
-
 Prostate cancer was highest among individuals 60 years and older.
Top 10 Leading Cancers, 2003–2008
With 2,688 registered cases and 1,319 deaths,
prostate cancer
was the leading cancer overall (20.6%) and among men (40.7%).
Incidence rate: 69 cases; Mortality rate: 34 deaths per 100,000 men
With 2,182 registered cases and 598 deaths,
breast cancer
was the second-leading cancer overall (17.0%) and the leading cancer among women (33.9%).
Incidence rate: 56 cases; Mortality rate: 15 deaths per 100,000 individuals
Figure 5.2:
Lifetime Risk of Leading Cancers, 2003 to 2008
Age-Sex-Specific Incidence Rates of
Top 5 Leading Cancers, 2003–2008
Figure 5.3:
Age-Specific Incidence Rates of the Top 5 Leading Cancers in Males for the Period 2003 to 2008
Figure 5.4:
Age-Specific Incidence Rates of the Top 5 Leading Cancers in Males for the Period 2003 to 2008
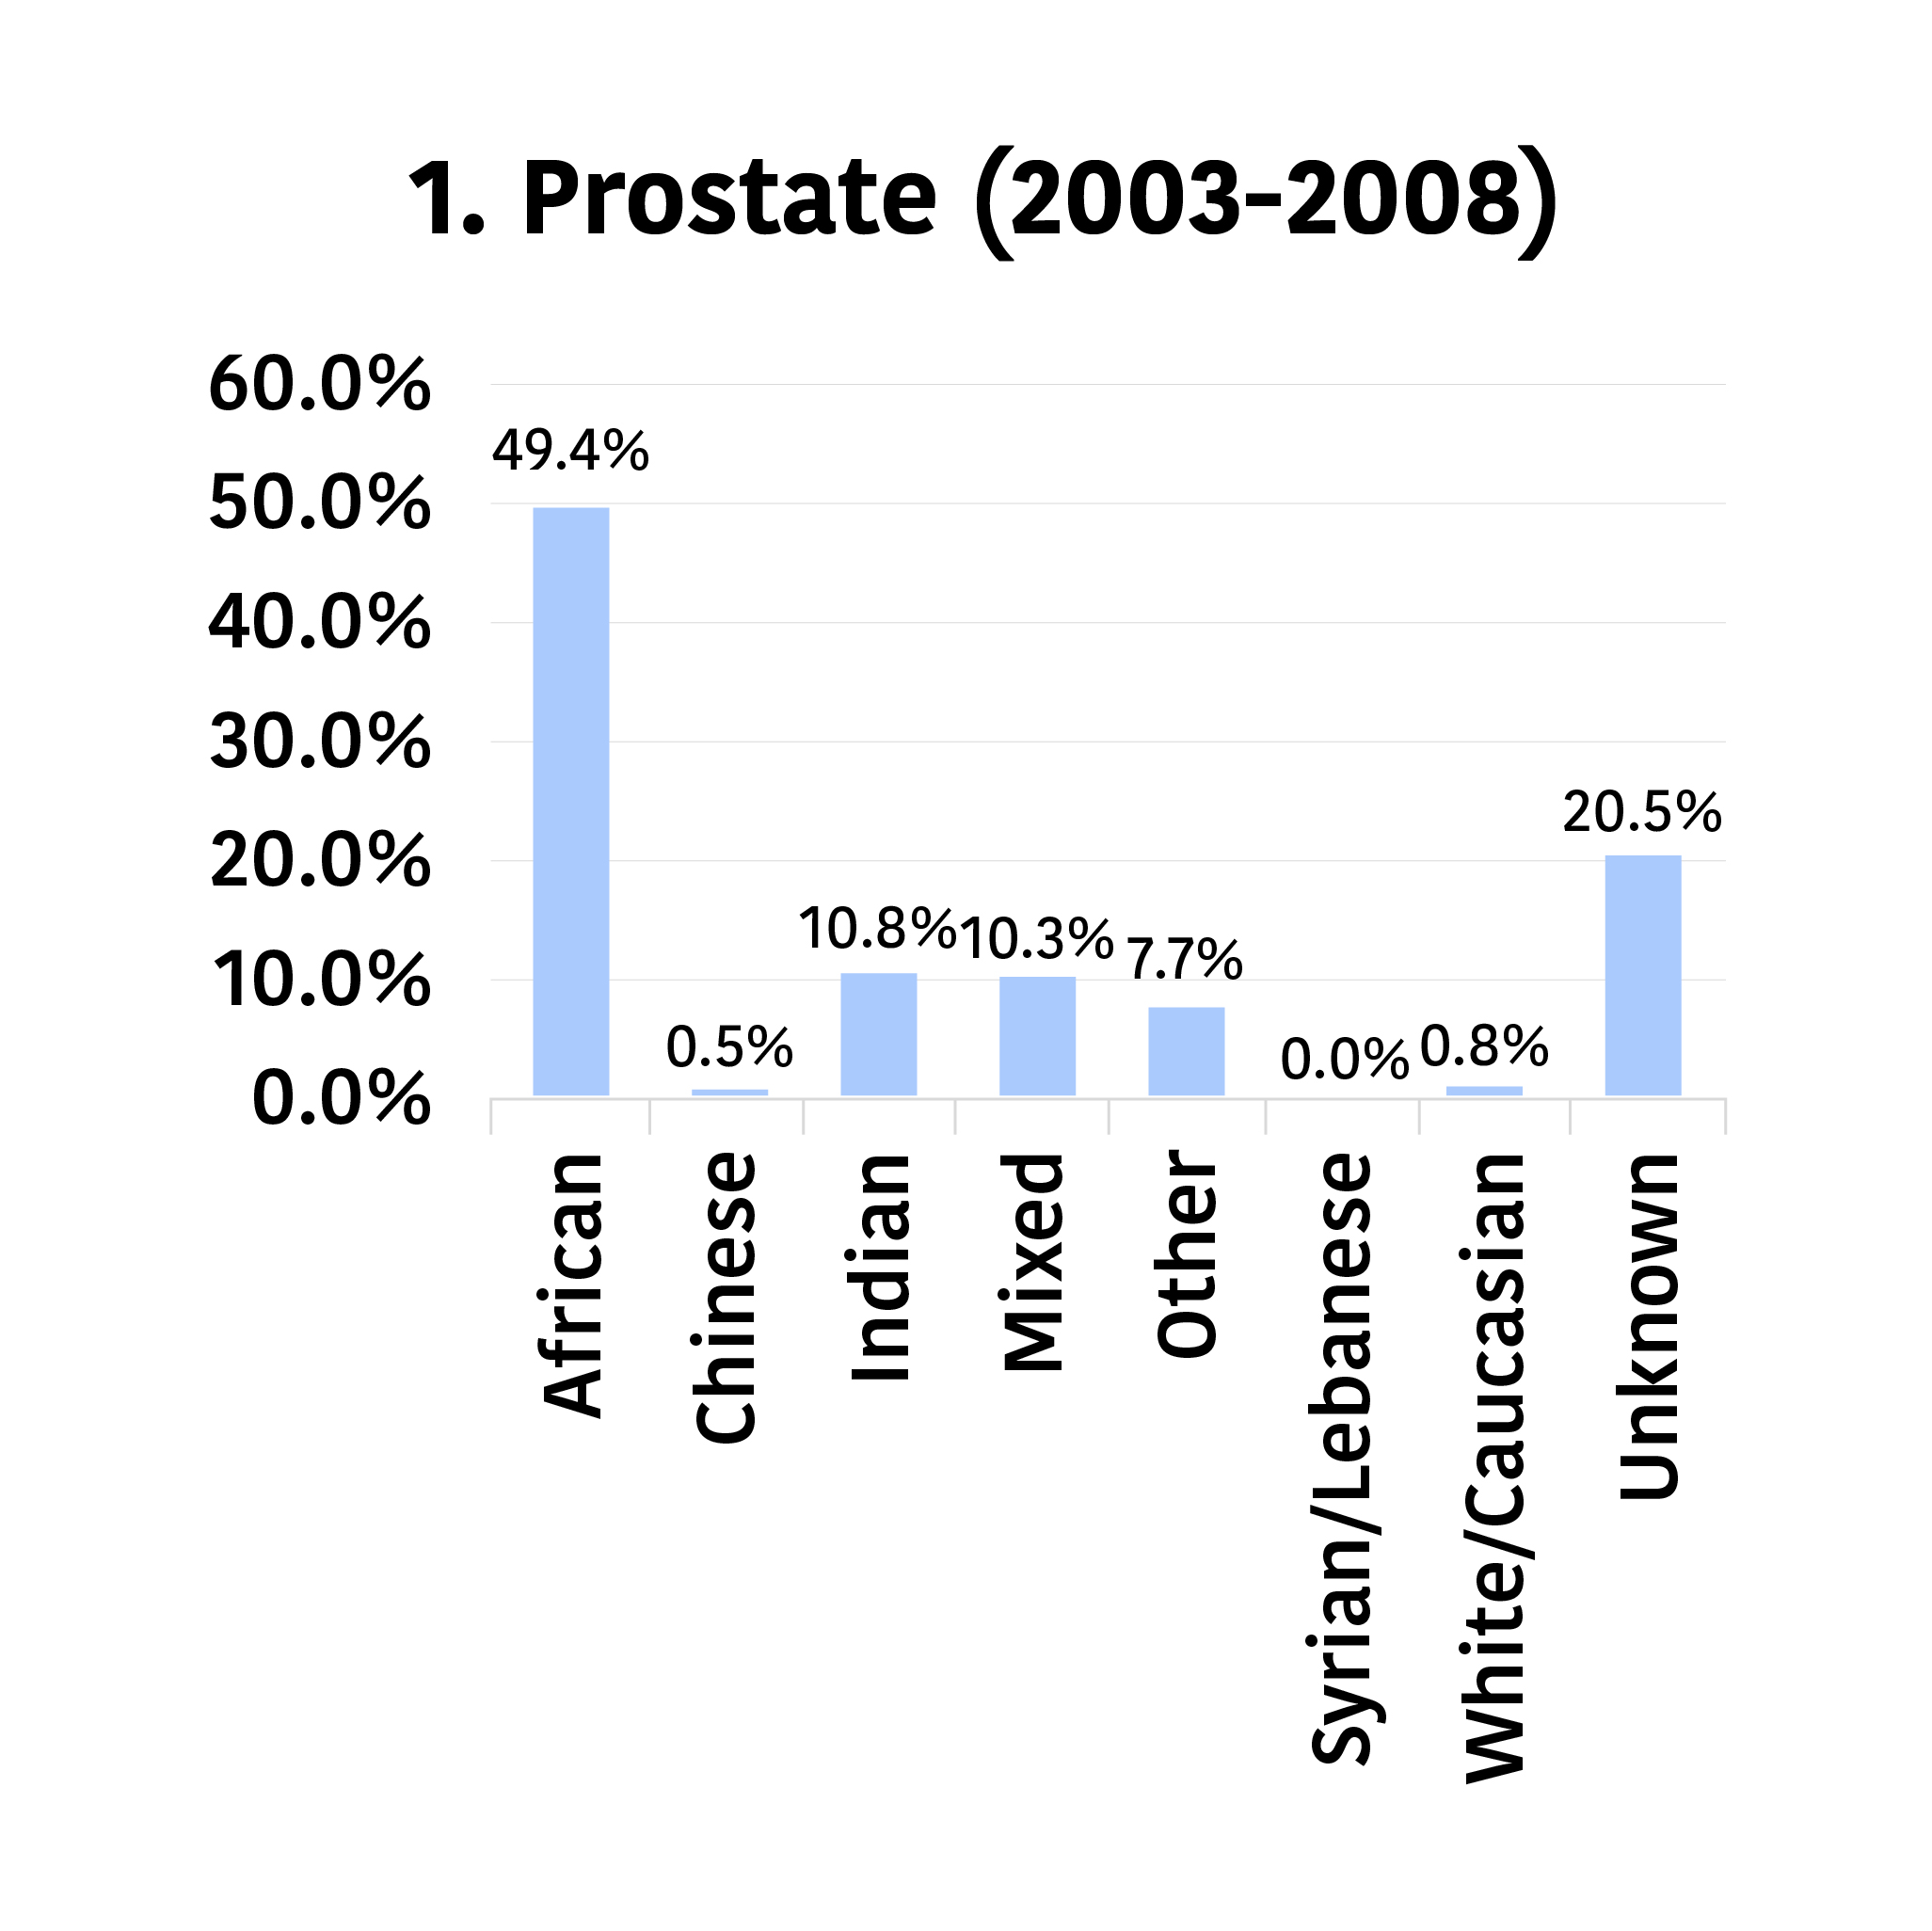
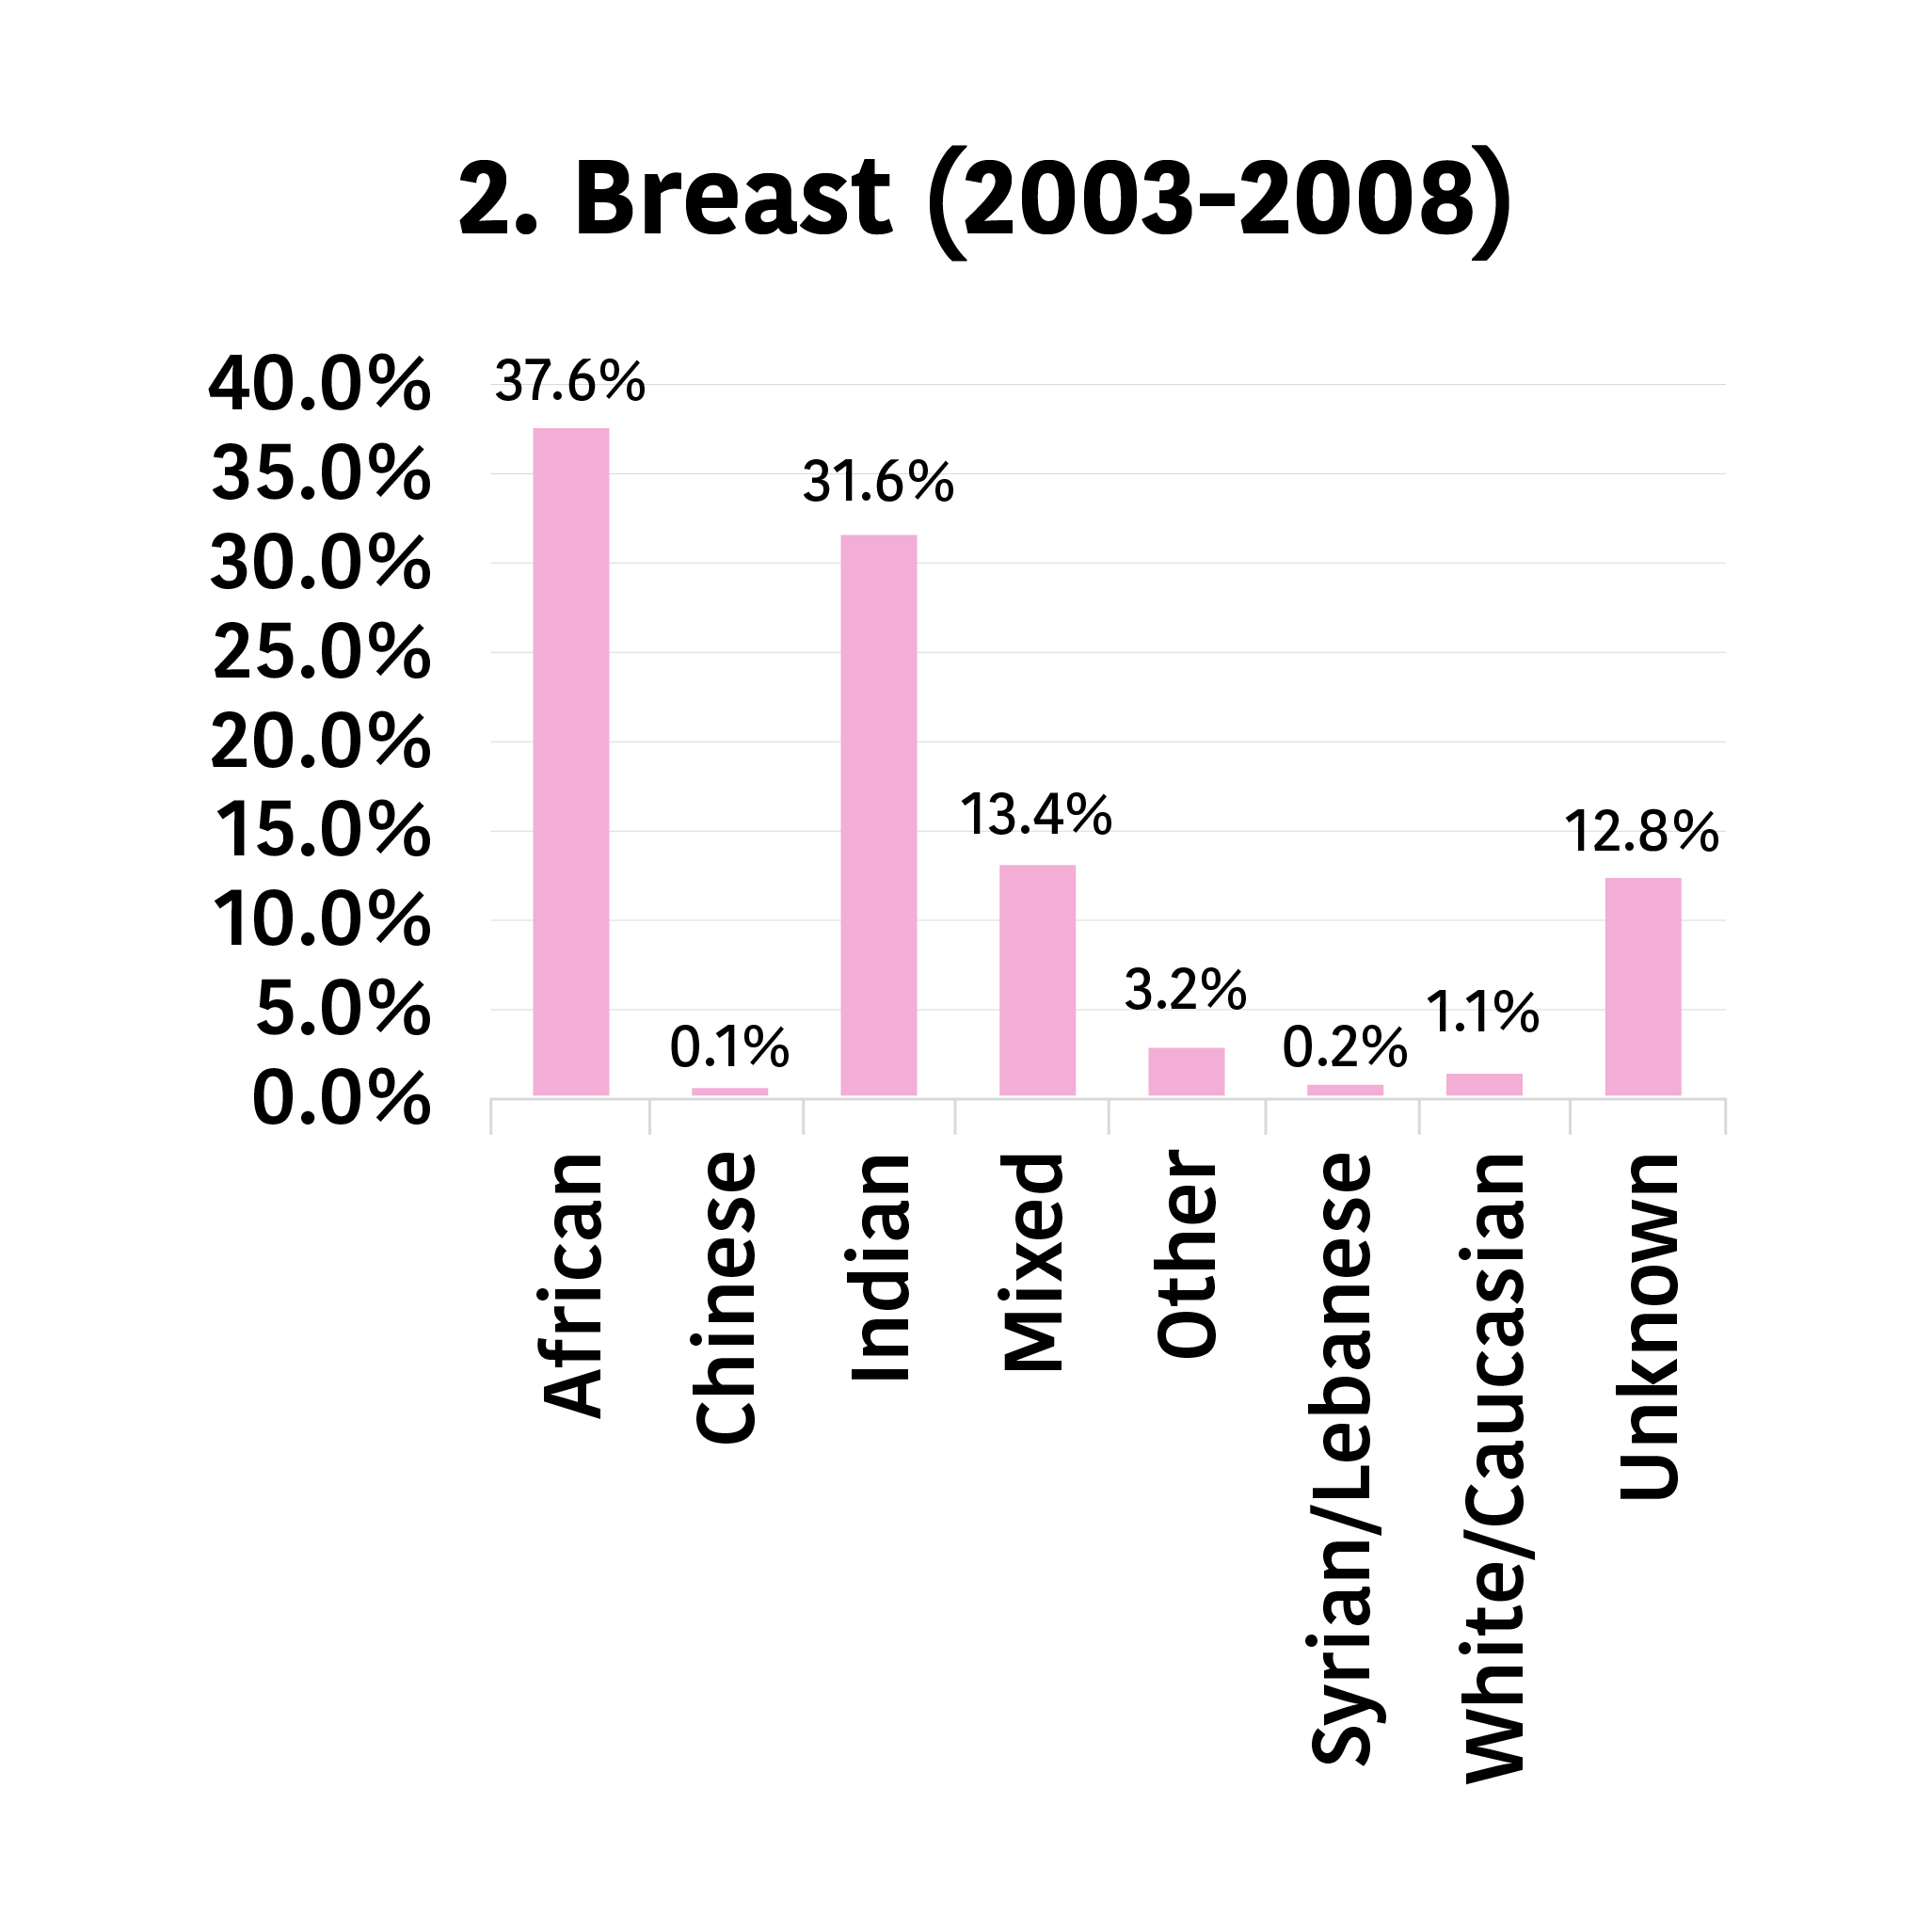
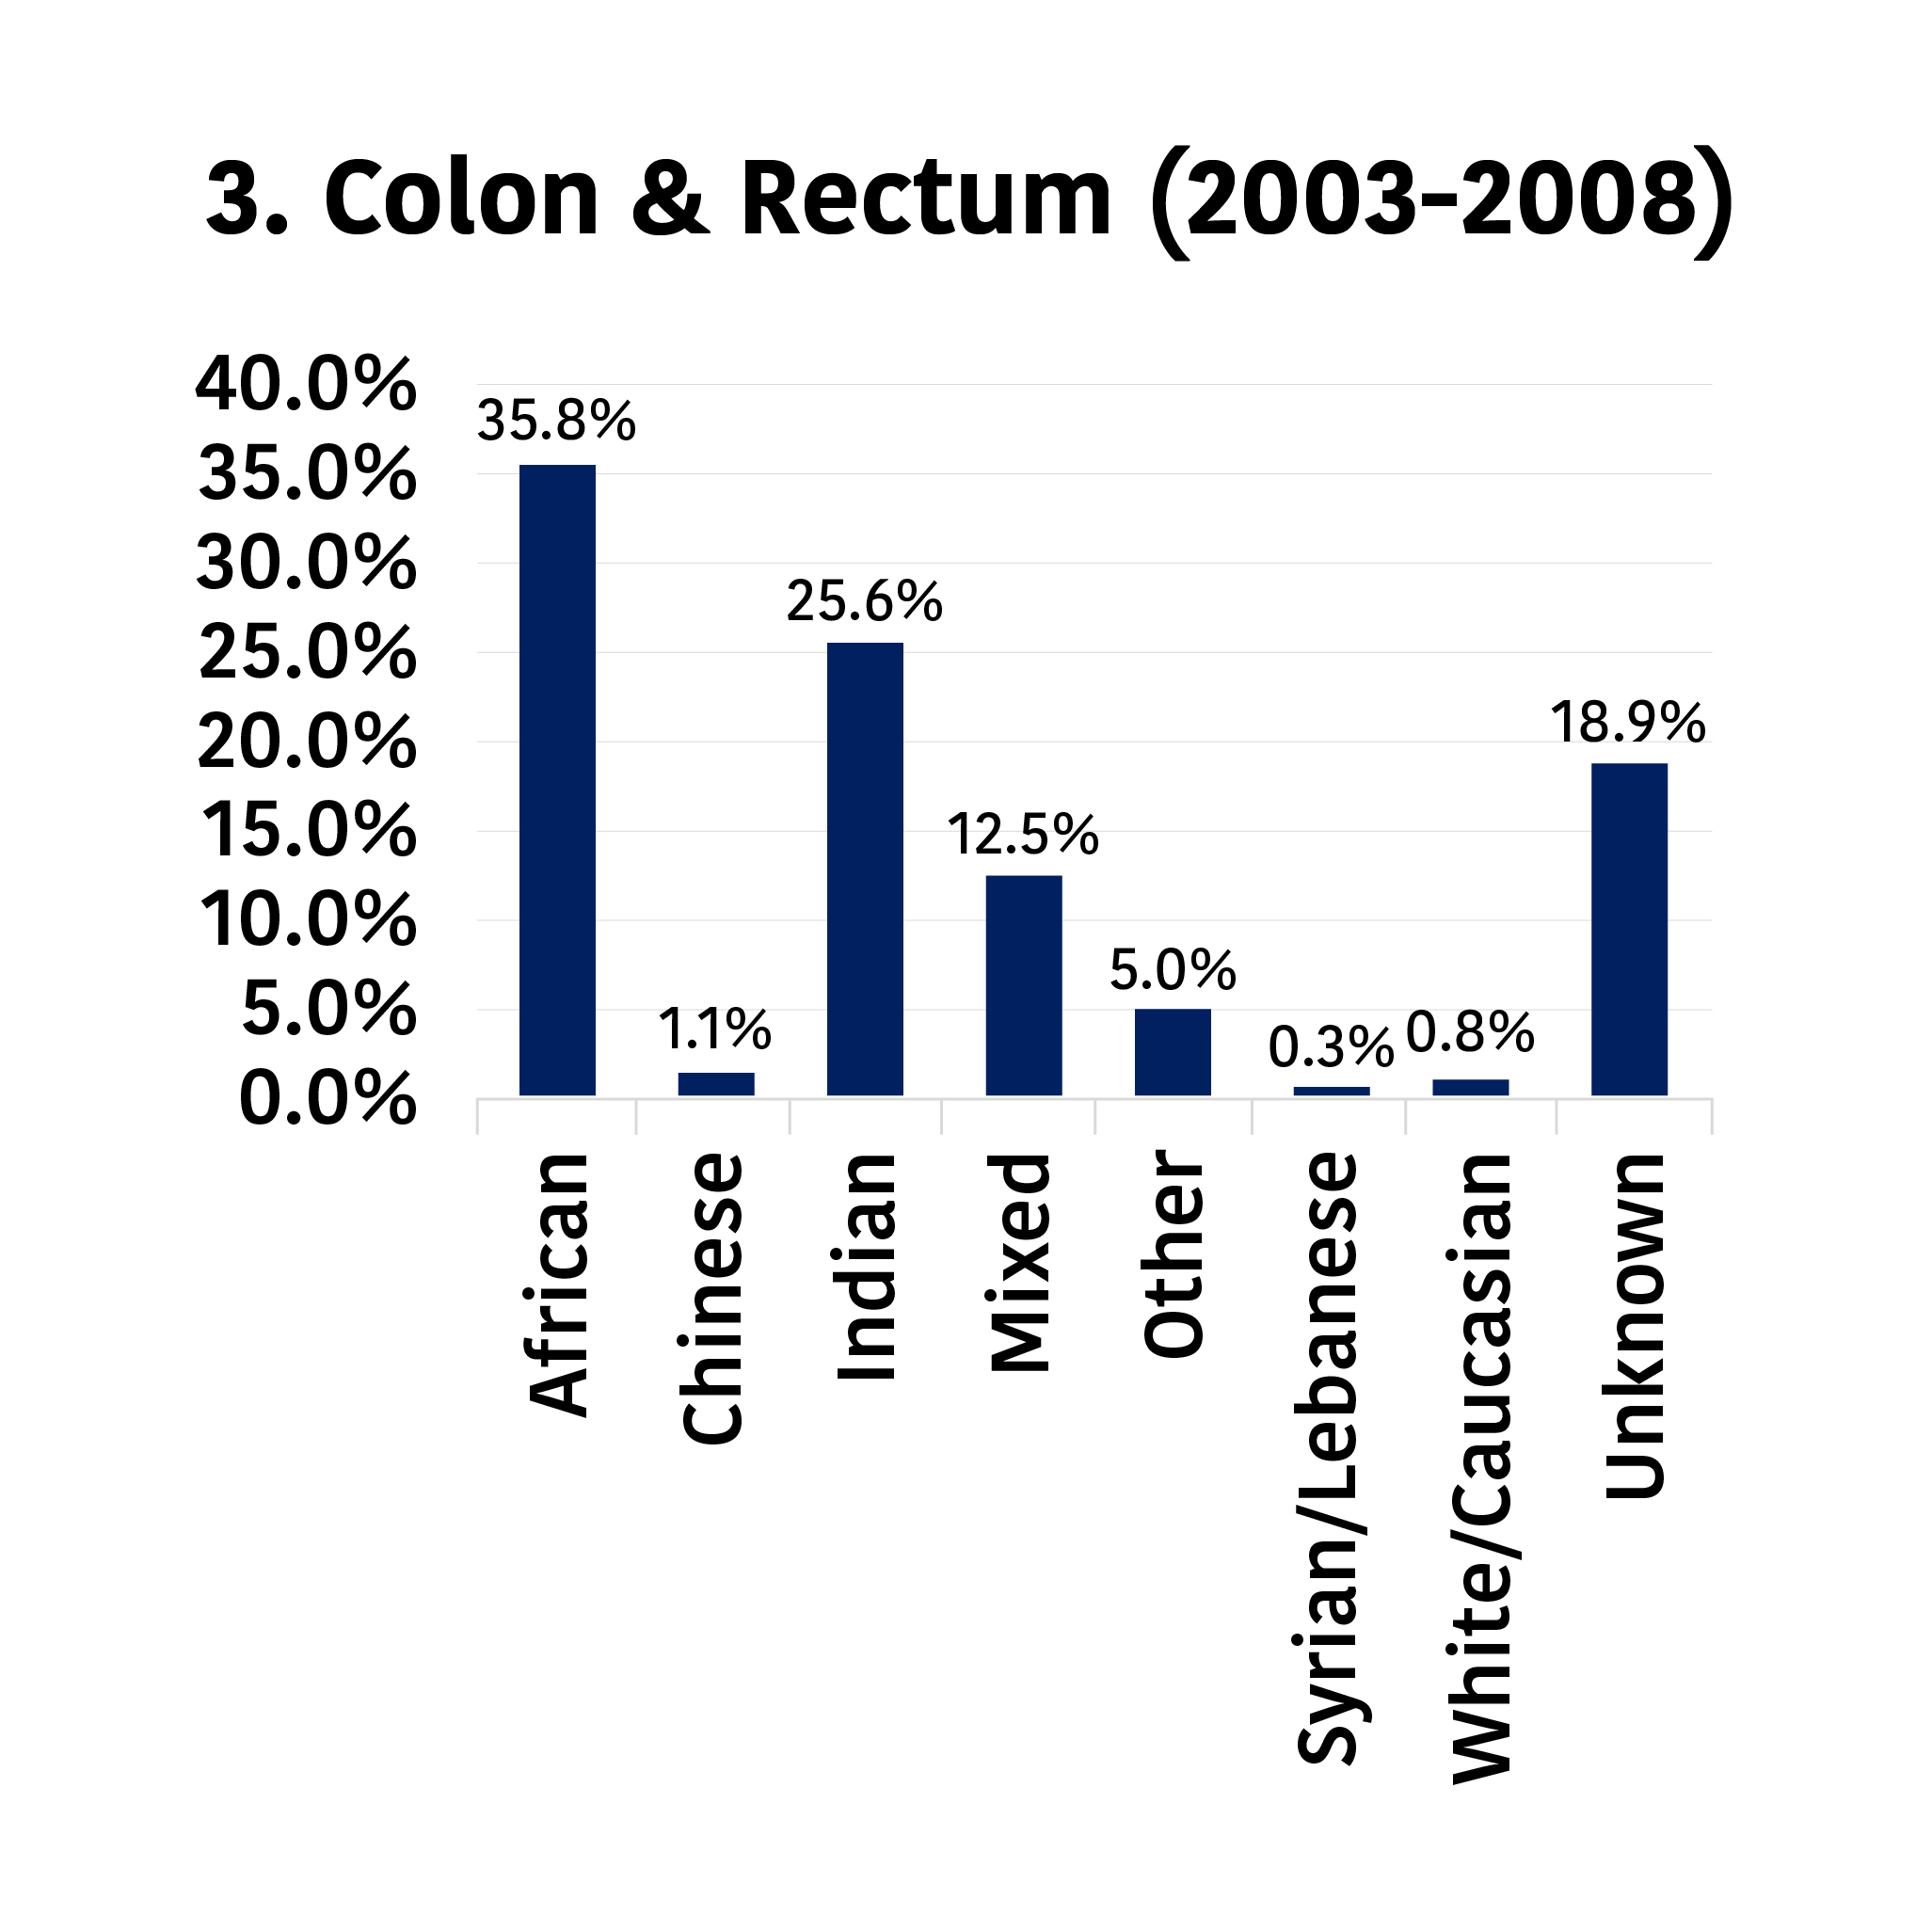
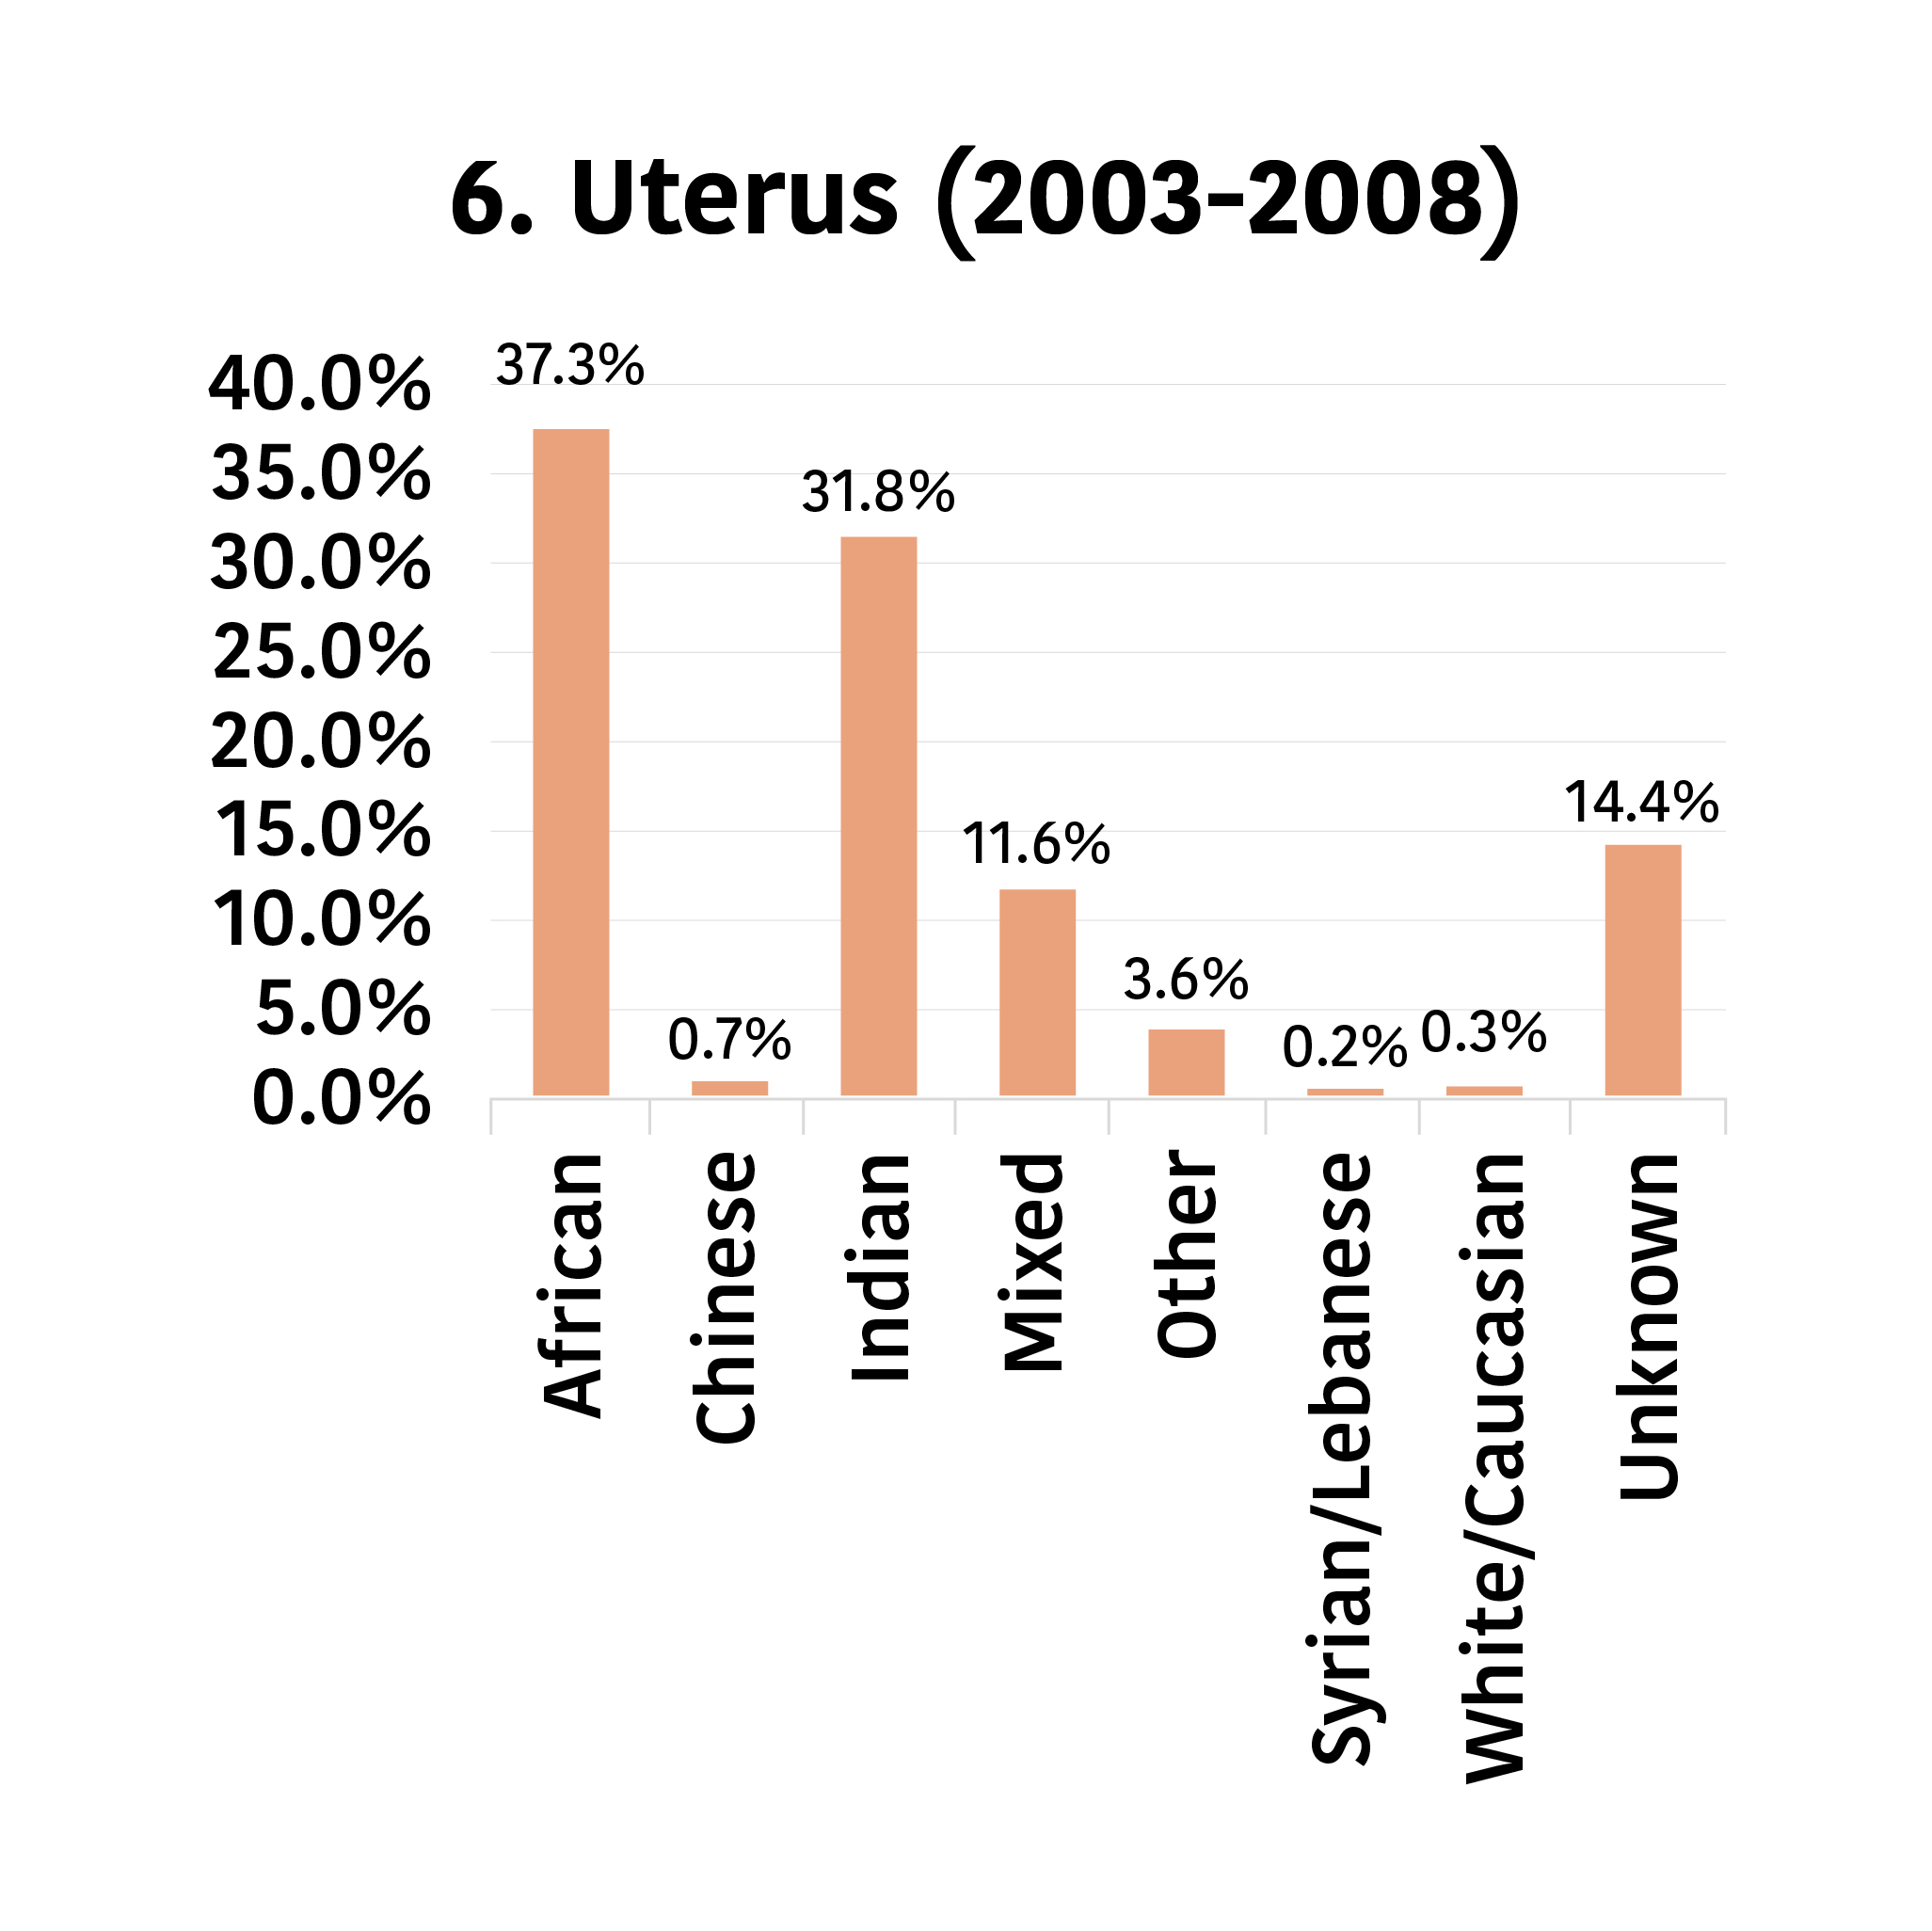
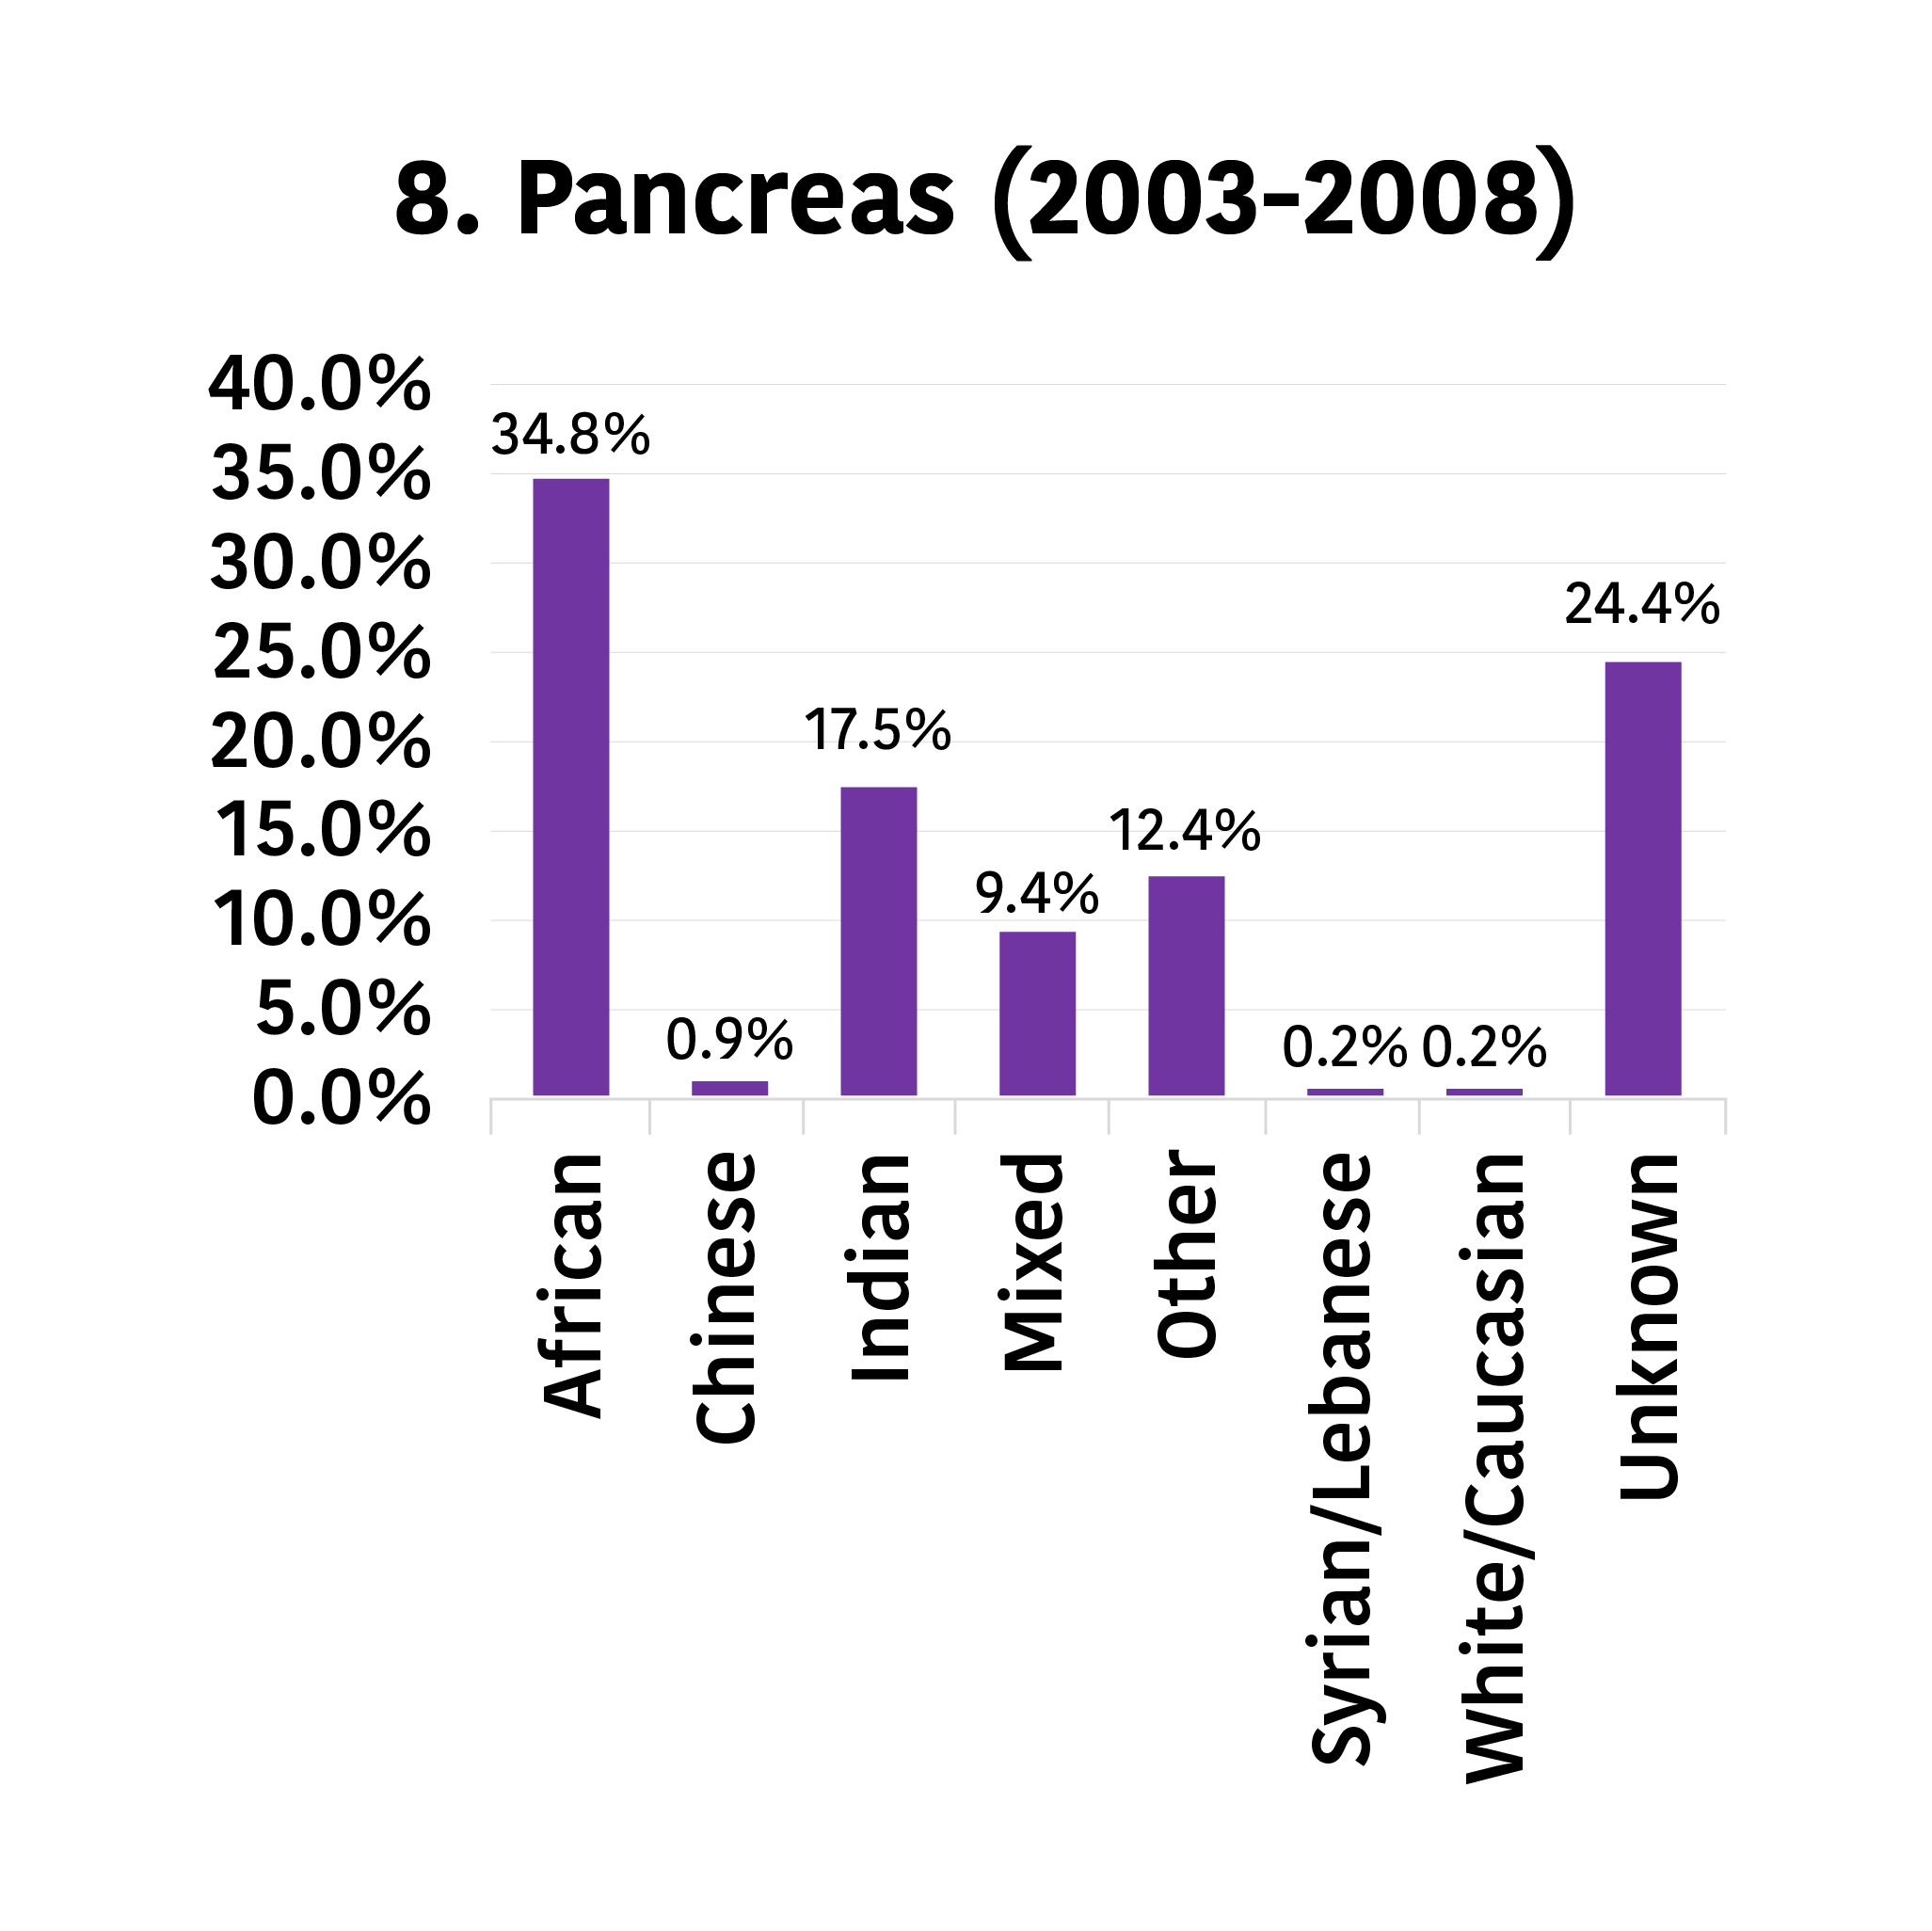
Top 8 Leading Cancers by Ethnicity, 2003–2008
The percentages indicate the proportion of ethnicity within a particular cancer.
×
![Popup Image]()